Optical imaging of odor-driven calcium responses allows to measure the responses of several glomeruli to the same olfactory stimulus. In the honeybee, olfactory glomeruli can be identified individually. Therefore, the responses can be attributed to these identified glomeruli and compared among individuals. We have shown that homologous glomeruli share the same response profile. We have now laid the foundations to creating a functional antennal lobe atlas. This is to be a reference work in which the olfactory response spectrum of each glomerulus will be available, or - conversly - the response pattern across the glomeruli for each substance will be available. The number of substances tested and of glomeruli identified will increase constantly.


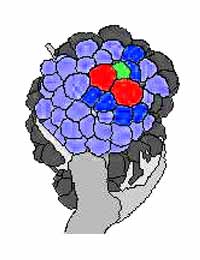
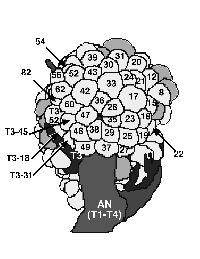
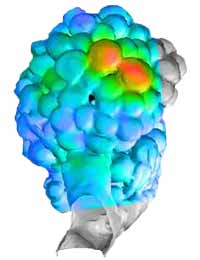
Please navigate the atlas using the links in the blue bar above. You can select for different odors, or odor groups. Naturally, the information increases with time, and so does the available material. For each odor, you will get at least a schematic view of the antennal lobe, in which response intensity is color-coded red-yellow-green-bright blue-dark blue. Glomeruli that have not been measured are gray. The identities of the glomeruli are shown on this page, above. By clicking on the activity image the antennal lobe appears as a three-dimensional animation, showing that much of the antennal lobe has still to be characterized. Where indicated, n indicates the number of animals evaluated for that odour.
The structure of available material is given here:
| (Measurement type) | (Odor groups) | (Concentration/Subgroup) | comment |
| Select | this page | ||
| Bath application | Home | ||
| Alkanes | One concentration | C5 to C13 | |
| Aldehydes | One concentration | C5 to C10 | |
| Carboxyl. acid | One concentration | C5 to C9 | |
| Prim. alcohols | One concentration | C5 to C10 | |
| Sec. alcohols | One concentration | C6 to C9 | |
| Sec. ketones | One concentration | C5 to C10 | |
| Other odors | One concentration | several odors | |
| Aliph. hydrocarbons | Chainlength C5 | ||
| Chainlength C6 | |||
| Chainlength C7 | |||
| Chainlength C8 | |||
| Chainlength C9 | |||
| Chainlength C10 | |||
| Projection neurons | ...coming soon... | ||
Don't hesitate to contact us!